UX research in cartography
Before product design, I spent seven years studying how people read maps, and where "fight for the user" started for me.
- Where
- Masaryk University, University of Zürich
- Role
- Researcher, PhD in cartography
- Years
- 2009–2016
- Methods
- Eye-tracking, usability tests, psychological testing
Background
I studied cartography and then stayed in academia as a researcher at Masaryk University in Brno, with a guest postdoc at the University of Zürich. I was part of the Center for Experimental Psychology and Cognitive Sciences, where cartographers and psychologists worked together on how people use maps. Topics included map reading, wayfinding, spatial decision-making, cross-cultural differences and stress.
We used a mix of methods: quantitative and qualitative tests, eye-tracking, 3D and pseudo-3D visualisation, virtual reality and psychological testing. Running those studies changed how I looked at making things. I stopped asking whether a map was correct and started asking whether people could actually use it. That question took me out of academia and into product design, and it's still how I work: every design decision gets checked against evidence from real users.
Selected papers
Five peer-reviewed papers out of a longer list. The rest are on ResearchGate.
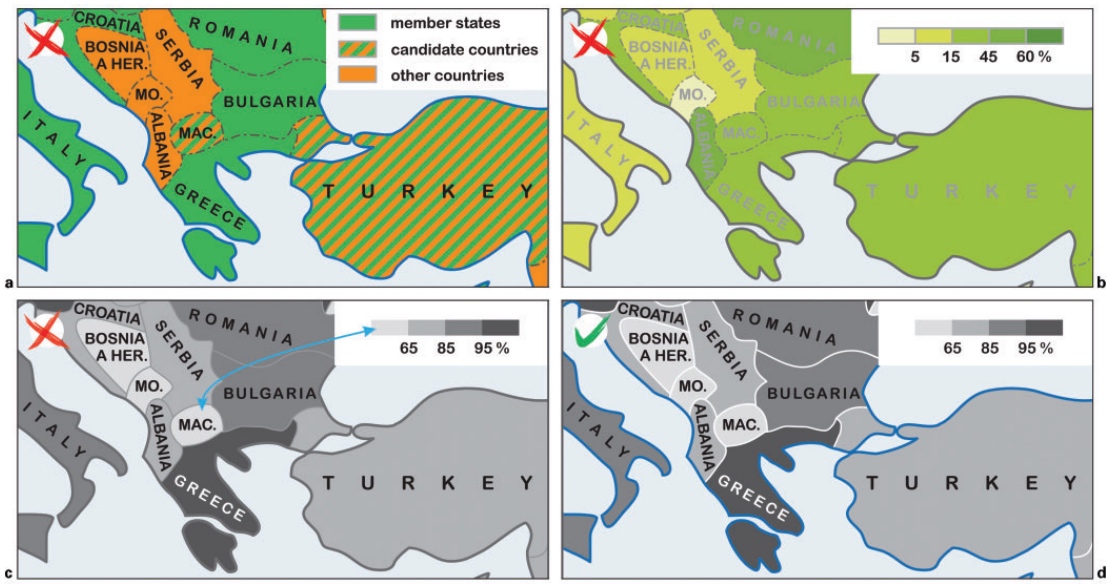
- Cross-cultural differences in figure–ground perception of cartographic stimuli Czech and Chinese participants read the same maps with two equivalent symbol sets that varied in contrast with the base map. Culture did affect map reading, but not in the direction earlier studies predicted. That matters for any map designed for global online use.
- Cartographic design and usability of visual variables for linear features A between-subject study of response times and errors on traffic-map tasks. Colour hue and size communicated information better than shape and colour value, and individual cognitive style affected performance.
- Colour contrast in cartographic works using the principles of Johannes Itten Applies Itten's seven colour contrasts to thematic maps, with original examples of where each one helps or hurts readability.
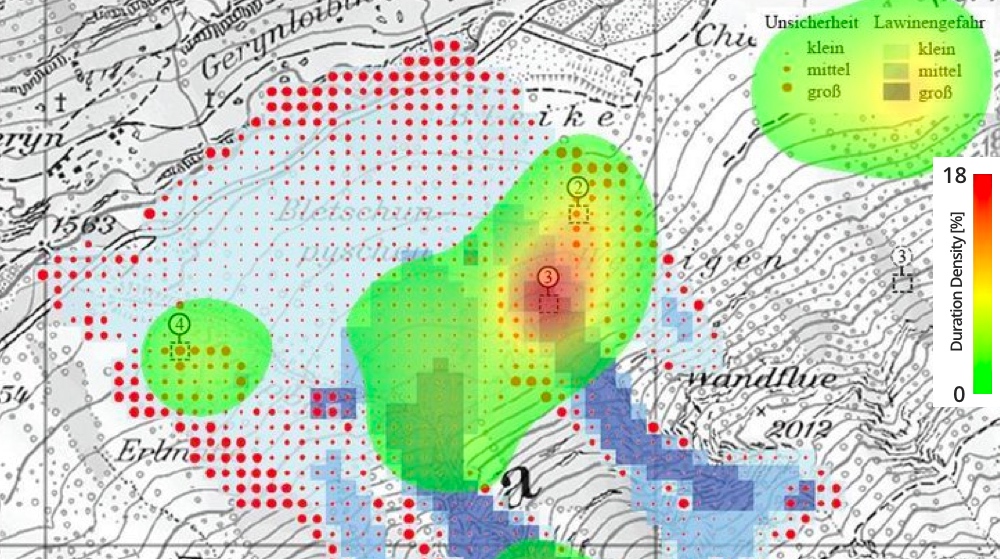
- Mixed research design in cartography: a combination of qualitative and quantitative approaches A method for evaluating maps that pairs quantitative performance measures with qualitative eye-movement analysis, tested on two ways of visualising avalanche hazard.
- Influence of graphic design of cartographic symbols on perception structure Two symbol sets by different authors on the same topographic map, looking at how symbol size, structure and shade shape what people perceive, and how cognitive style plays in.